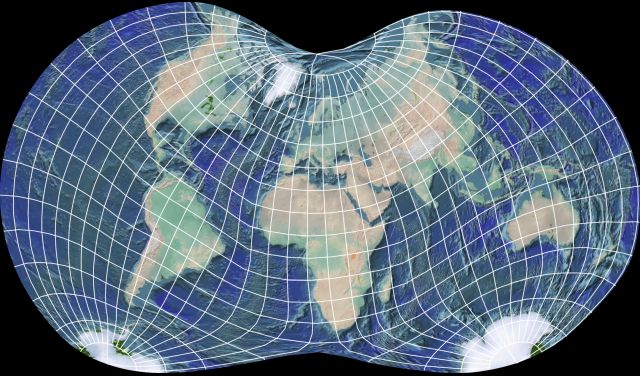
The Laskowski Tri-Optimal Projection,
has its x and y coordinates calculated as polynomial functions of the latitude and longitude where the coefficients were chosen to minimize the area and shape errors of the projection: that the pole-line circles around to touch itself is an interesting and unusual feature of this projection.
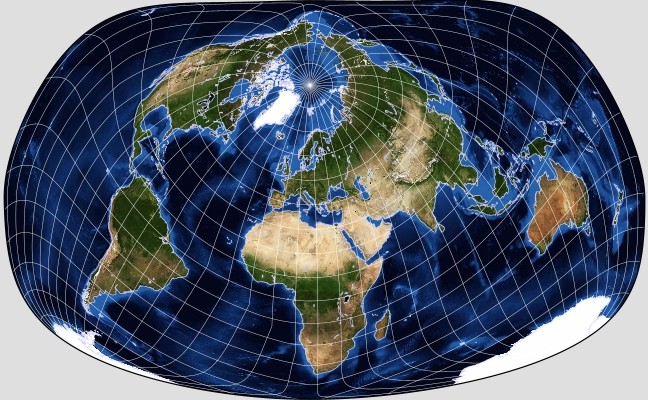
In the oblique orientation that I have used to examine several other projections,
it can be seen that the attractiveness of this projection does not depend on its being used in the conventional aspect only, even if its behavior in the polar regions, as apparent in the conventional case, seems to unnecessarily squash things there (giving something of the appearance of an orthoapsidal projection based on a ball of crochet cotton).
The x and y coordinates on the projection are calculated by means of polynomials whose coefficients were determined by numerical methods; this projection was the outcome of the discovery of a more effective way of doing this, using the mathematical technique of Singular Value Decomposition.
With angles in radians, the polynomials used are:
x =   .975534  * long

                            2
    - .119161  * long  * lat

                            4
    - .0547009 * long  * lat

                     3      2
    - .0143059 * long  * lat
and
y =  1.00384     * lat

                              2
    + .0802894   * lat  * long

                              4
    + .000199025 * lat  * long

                      3
    + .0998909   * lat

                      3       2
    - .02855     * lat  * long

                      5
    - .0491032   * lat
This projection was featured in the April 1998 issue of the journal Cartographia (volume 34, number 3), along with a large number of other polynomially-based projections resulting from optimizing various combinations of area, shape, and distance between points. Hence the name of this projection, as three factors were optimized in its design. Five thousand randomly selected points were used as the basis on which to perform the optimization.
That entire issue of the journal was given over to three papers by him. As the first set of projections attempted to optimize against shape distortions alone, the first few closely resembled the Mercator, which doubtless produced a few inward groans as people first turned to the relevant page.
I was sufficiently intrigued by seeing a map drawn in Canters' Minimum-Error Polyconic projection in Chapter 8 of the book at this location to attempt to determine how it was drawn. At first, I tried to see if it had been drawn on the principle of the Aitoff-Wagner projection, but when that failed to produce sufficient sharpness at the pole line, I realized that it was likely to be based on polynomials, like the Laskowski Tri-Optimal, and after some trials, I obtained a set of approximate coefficients.
These allowed me to plot the following map:
After locating the paper in which this projection was described, in the summer 1989 issue of Cartographia (volume 26, number 2, pp. 53-71), I discovered, though, that I abused the projection, as it was optimized for distortion only over the land masses, as they would appear with the projection centered at 0 degrees longitude, not at 10 degrees East longitude, as I have consistently used for conventional world maps to avoid interrupting Siberia.
The actual coefficients for this projection, with the latitude and longitude given in radians, as they appeared in that paper were:
x =  0.8478   * long

                           2
    - .1702   * long  * lat

                    3      2
    - .0062   * long  * lat

                           4
    + .0036   * long  * lat
and
y =   .9964    * lat

                            2
    + .0313    * lat  * long

                    3       2
    - .01      * lat  * long

                            4
    + .0009    * lat  * long
For both x and y, the last term of the polynomial as shown here is of a different type than in my attempt to fit the projection. However, Canters' real projection, as shown below:
is still almost identical to my attempt to match it, although a direct comparison will reveal that its vertical scale on the central meridian is just slightly larger.
This was only one of several projections described in his paper. One with the additional constraint that the vertical and horizontal scales be equal had the following coefficients:
x =  0.9305   * long

                           2
    - .1968   * long  * lat

                    3      2
    - .0067   * long  * lat

                           4
    + .0076   * long  * lat
and
y =   .9305    * lat

                            2
    + .0394    * lat  * long

                    3       2
    - .0115    * lat  * long

                            4
    + .0005    * lat  * long
and looks like this:
When imposing the additional constraint that the pole be a point, he exhibited two projections, quite different in appearance, one optimized for the same conventional orientation as shown here, and another optimized for an oblique projection, tilted 45 degrees forwards along a standard meridian of 20 degrees East longitude.
However, although that makes this projection no longer genuinely optimal, since it has a pleasing appearance, I thought it worth seeing what an oblique aspect of it would look like:
It may be noted that projections like those on this page, although they require a separate calculation for every point, unlike conventional projections and many other projections in normal case when drawn by hand, require only the evaluation of a polynomial rather than trigonometric functions. Thus, projections of this type are particularly well-adapted to plotting maps by computer. However, polynomially-based projections do look somewhat strange to the eye, because of such things as sharp points at the ends of pole lines, as seen here, and sometimes also other phenomena, such as a pole line that changes curvature back and forth. As the cost of computation continues to decline, it remains to be seen whether this form of projection will stand the test of time, or even achieve popularity in the first place.
Another somewhat well-known example of an attempt to create an optimal projection, this time also equal-area, is the Bertin-Riviére projection.
In 1953, Jacques Bertin empirically created an optimal projection which was popular in France; it was inspired by the Briesemister projection, and attempted to go further by moving shape distortion away from the continents towards the oceans.
Phillipe Rivière, in 2017, worked out a mathematical formula that approximated this projection, allowing it to be drawn in the computer age.
Here is an image by G.Projector showing its appearance:
Another projection that aims to represent the shapes of the continents well, with only a very limited amount of distortion in area, is the Danseiji III projection. This projection was designed by Justin Kunimune, whose program Map Designer was noted as allowing me to produce illustrations for my page on Conformal Projections based on the Dixon elliptic functions.